Customization
You can customize your plots by editing the base_plot_design object.
from google_calendar_analytics.authentication.auth import CalendarAuth
from datetime import datetime
from google_calendar_analytics.analytics import AnalyzerFacade
from googleapiclient.discovery import build, Resource # type: ignore
from google_calendar_analytics.visualization.visual_design import base_plot_design
import asyncio
creds = CalendarAuth(
token_path="./token.json",
credentials_path="./credentials.json",
).get_credentials()
start_time = datetime(2023, 3, 1)
end_time = datetime(2023, 3, 30)
base_plot_design.transparency = 0.8
base_plot_design.grid_width = 0.2
base_plot_design.grid_color = "white"
base_plot_design.line_shape = "spline"
base_plot_design.rgb_line_color = "rgb(0, 255, 0)"
base_plot_design.dark_theme = True
base_plot_design.show_title = False
base_plot_design.show_legend = False
async def main():
async with AnalyzerFacade(creds=creds) as analyzer:
coroutines = []
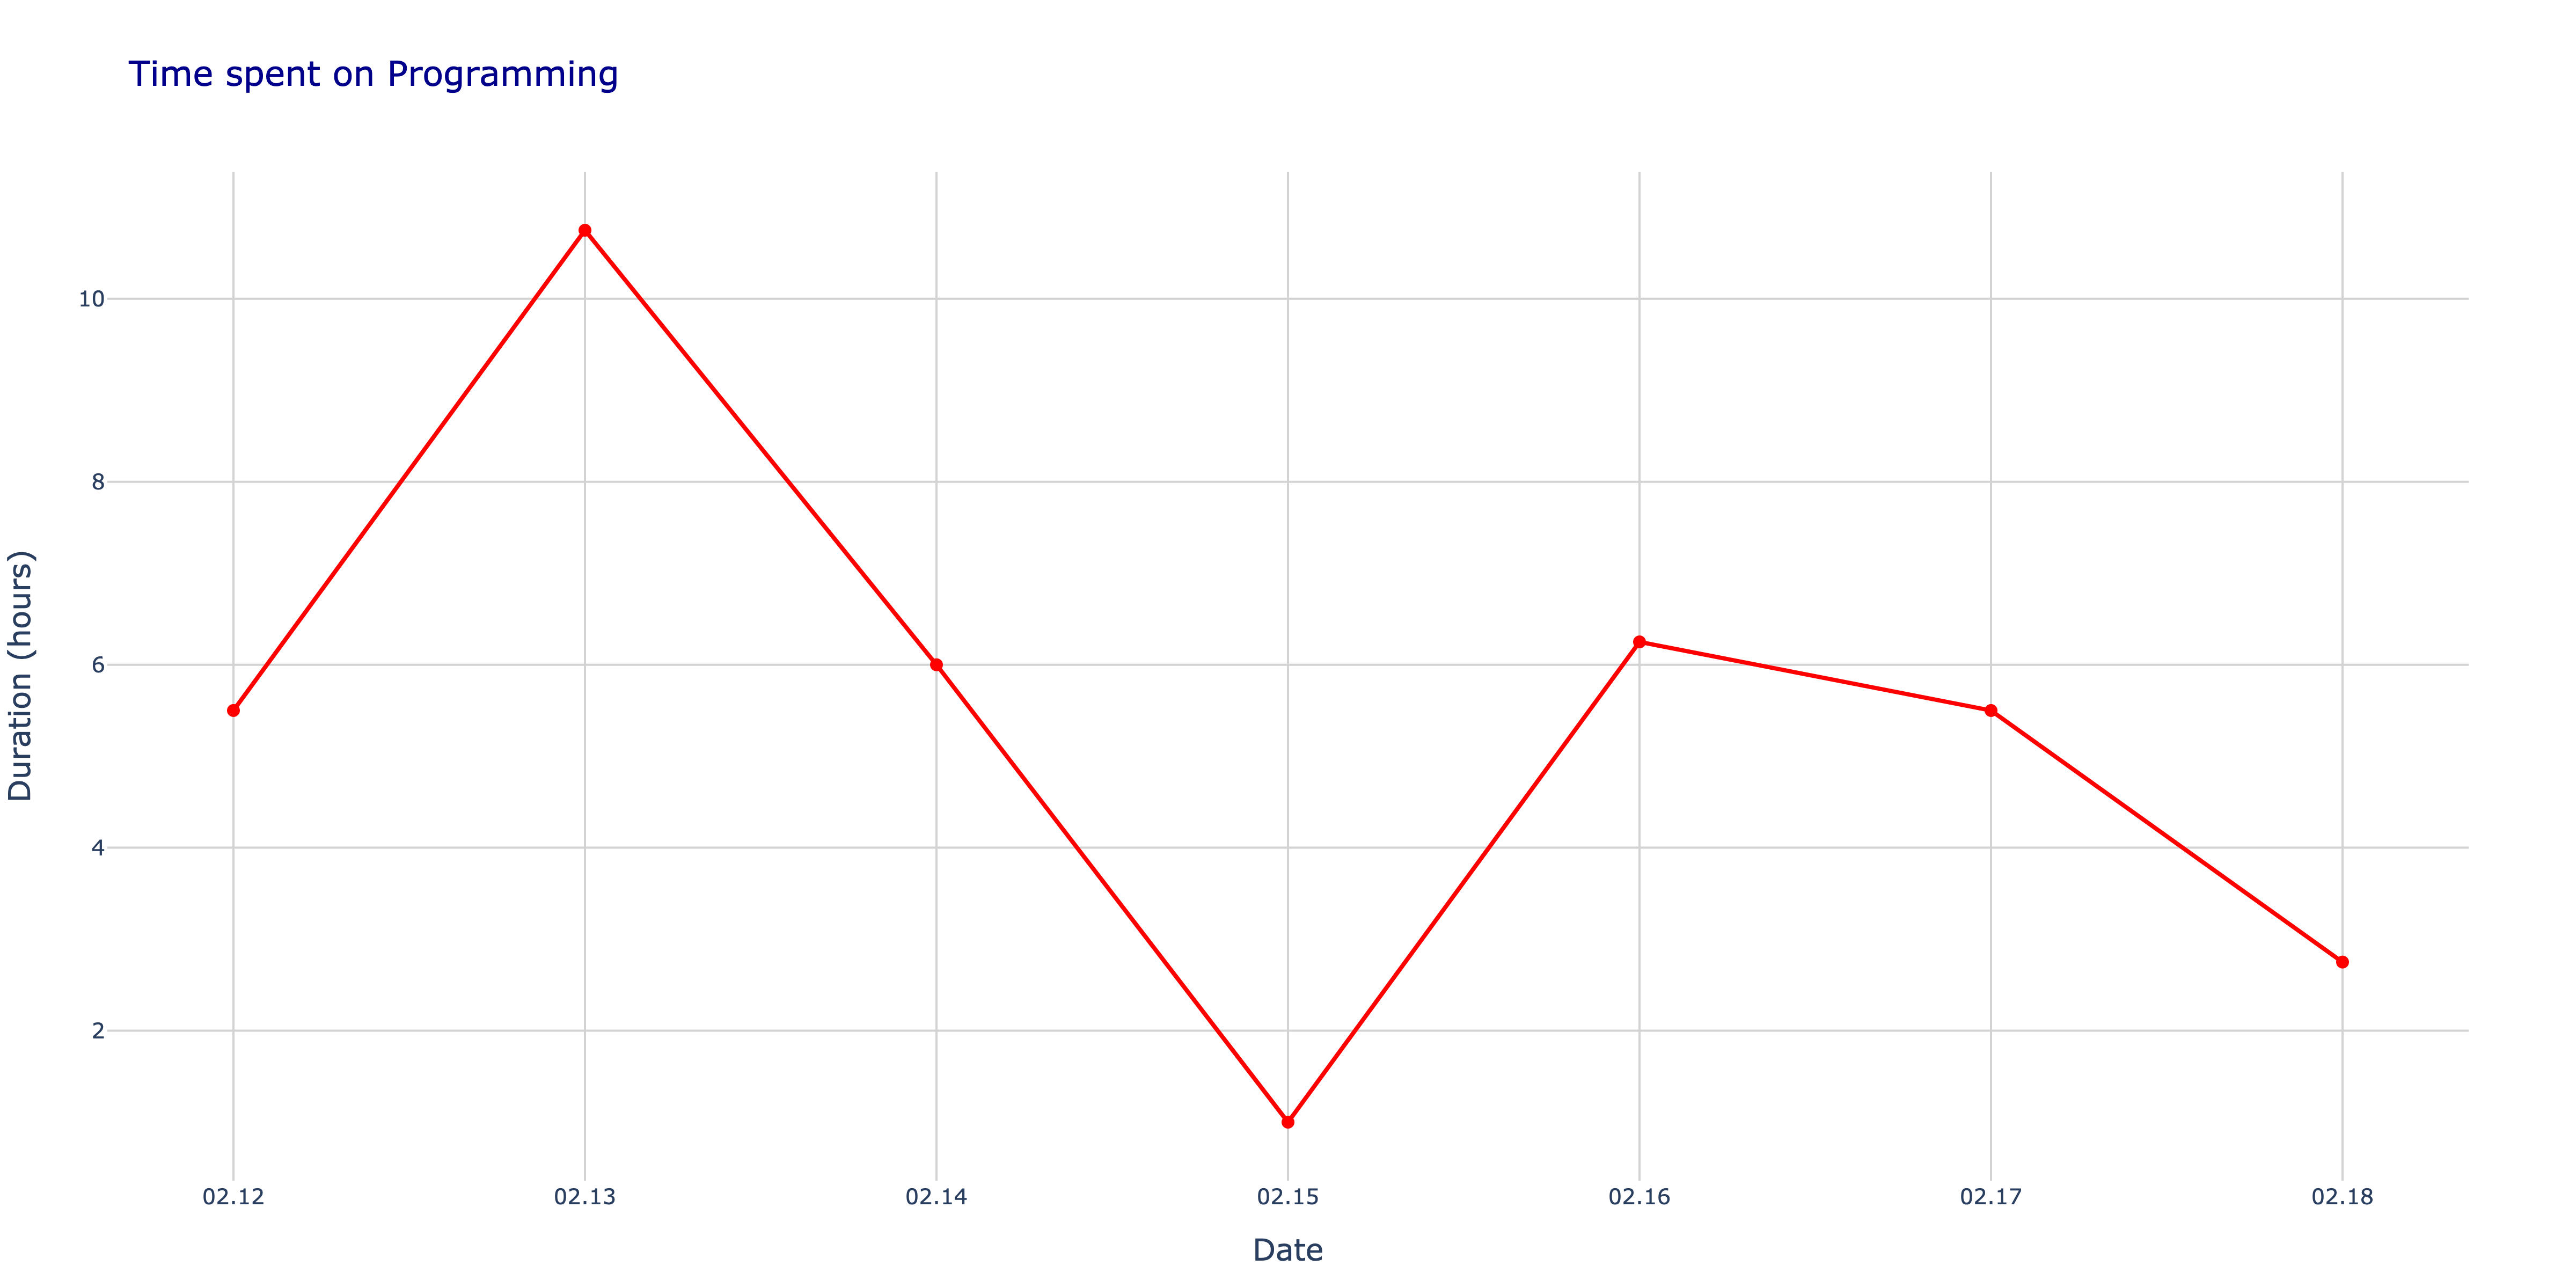
coroutines.append(analyzer.analyze_one(start_time, end_time, event_name="Programming", plot_type="Line", style_class=dark_plot_design))
result = await asyncio.gather(*coroutines)
for plot in result:
plot.show()
if __name__ == "__main__":
asyncio.run(main())
Also, you can create many design objects and use them in your code.
from google_calendar_analytics.visualization.visual_design import VisualDesign
sunny_design = VisualDesign(
transparency=0.5,
grid_width=0.1,
grid_color="white",
line_shape="spline",
rgb_line_color="rgb(0, 255, 0)",
dark_theme=False,
show_title=False,
show_legend=False,
)
rainy_design = VisualDesign(
transparency=0.5,
grid_width=0.1,
grid_color="white",
line_shape="spline",
rgb_line_color="rgb(0, 0, 255)",
dark_theme=True,
show_title=False,
show_legend=False,
)
async def main():
async with AnalyzerFacade(creds=creds) as analyzer:
coroutines = []
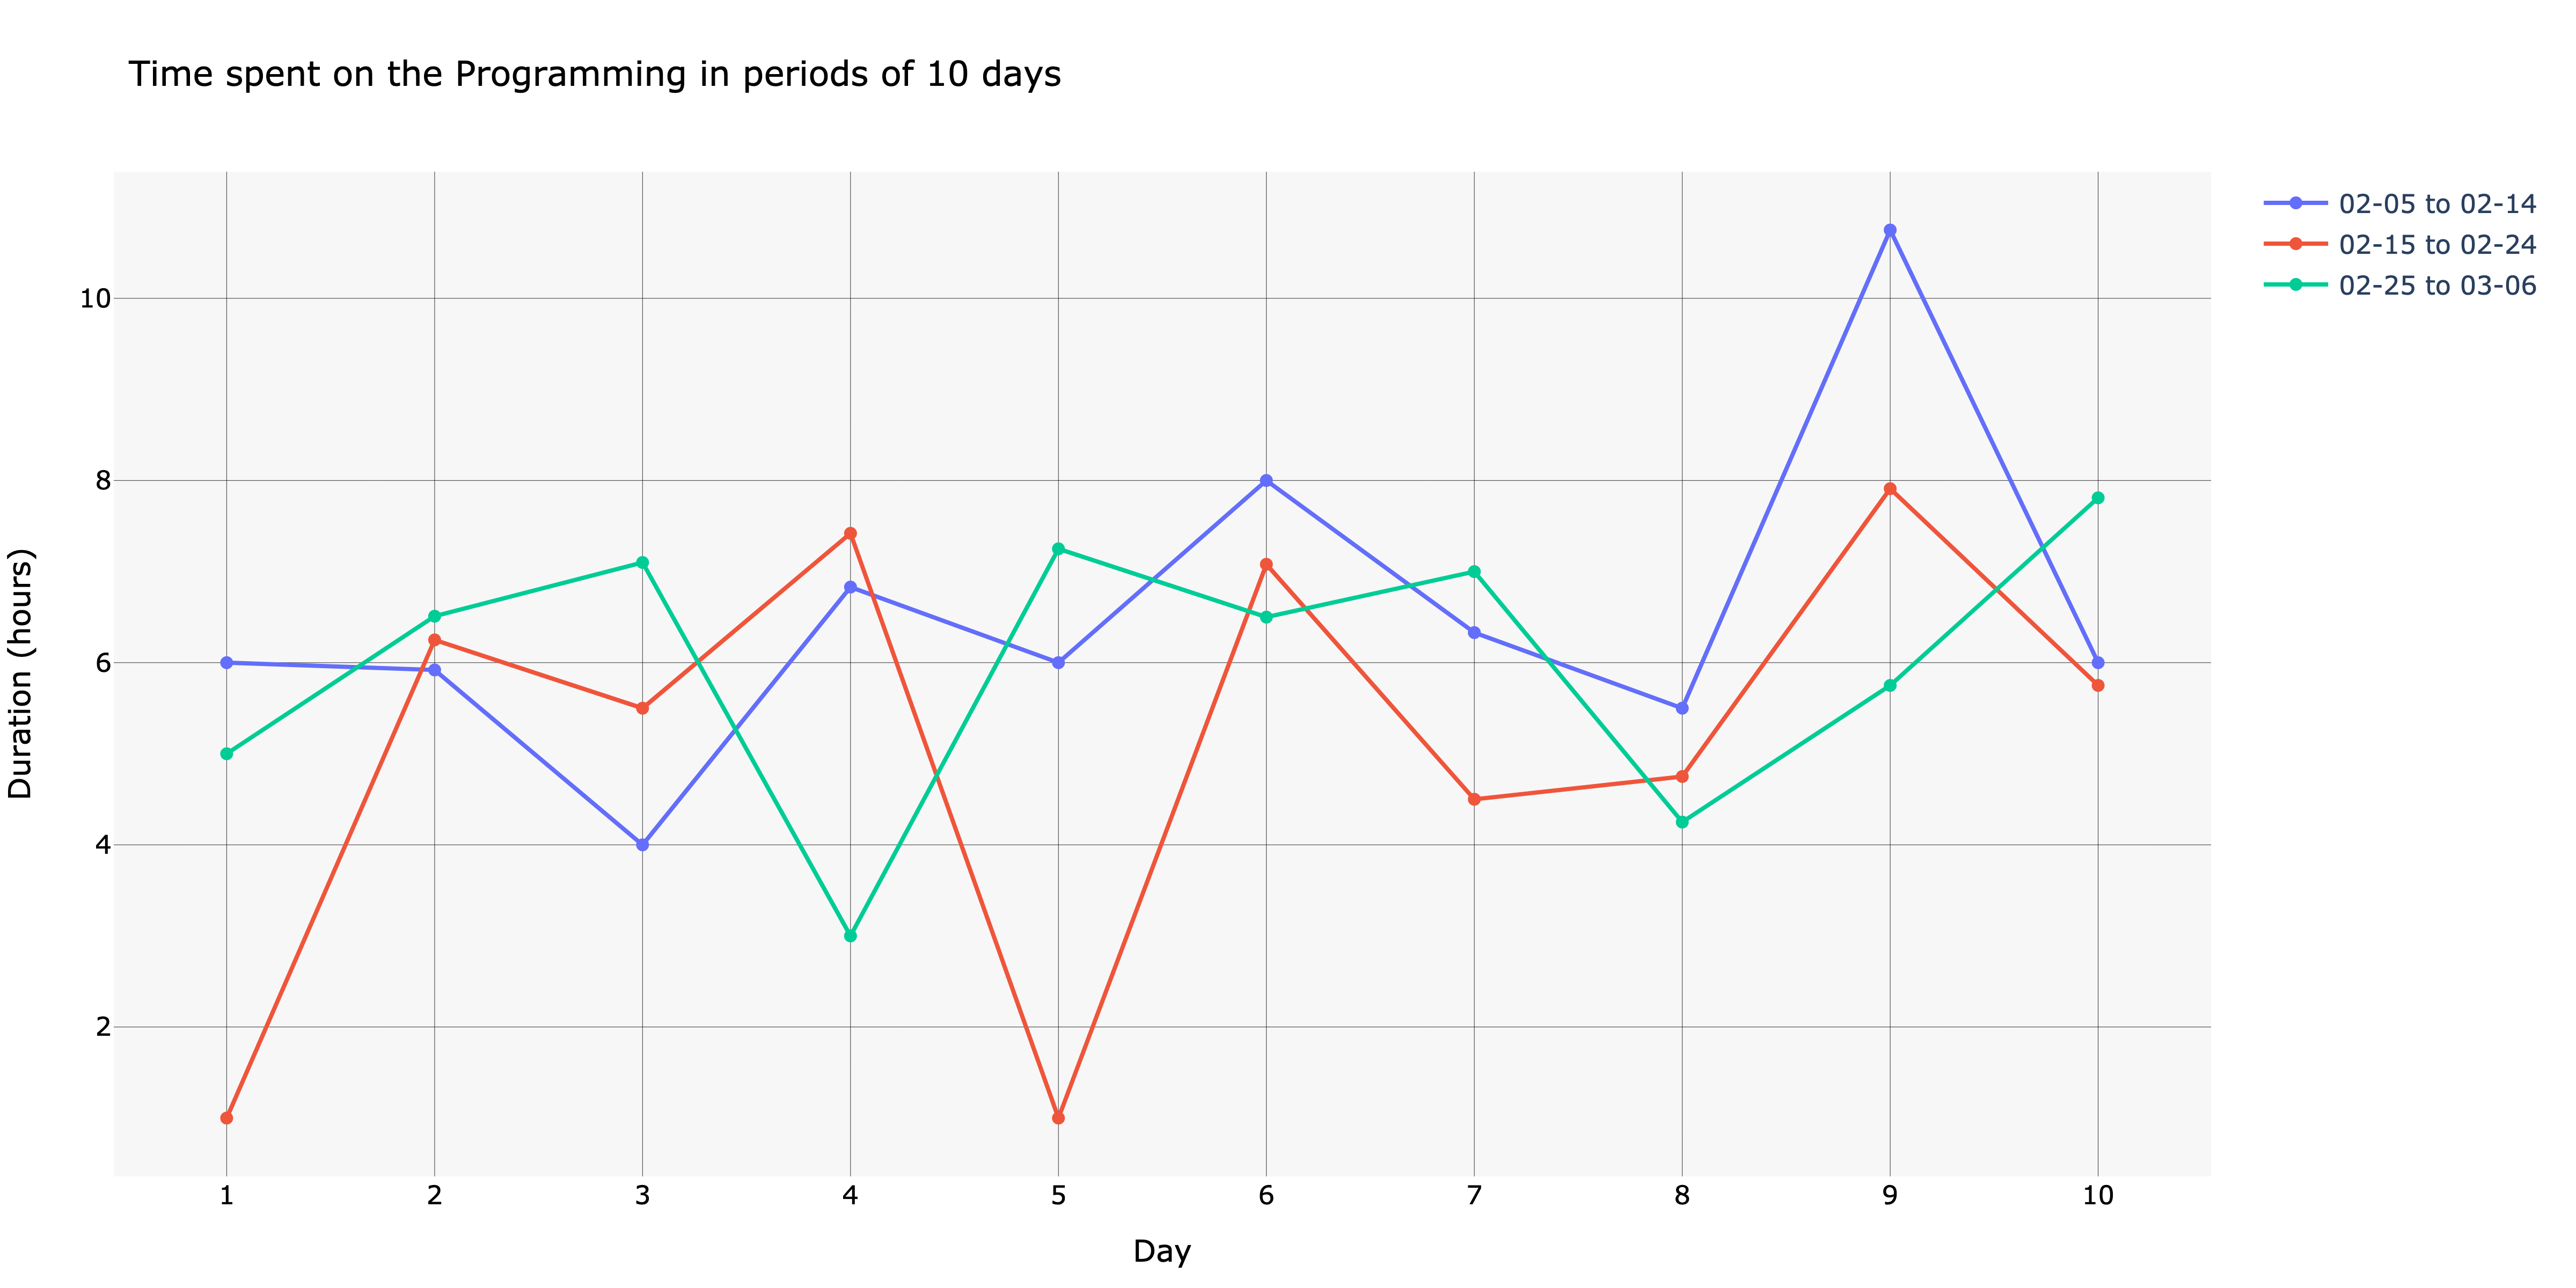
coroutines.append(analyzer.analyze_one(start_time, end_time, event_name="Programming", plot_type="Line", style_class=sunny_design))
coroutines.append(analyzer.analyze_one(start_time, end_time, event_name="Programming", plot_type="Line", style_class=rainy_design))
result = await asyncio.gather(*coroutines)
for plot in result:
plot.show()
Plot design
Available plot design variables:
A class that represents the visual design of the plots.
Source code in google_calendar_analytics/visualization/visual_design.py
__post_init__()
Check if the line_shape parameter is a valid line shape.
Source code in google_calendar_analytics/visualization/visual_design.py
title: Plot design
Plot types
You can choose from the following plot types:
Bar
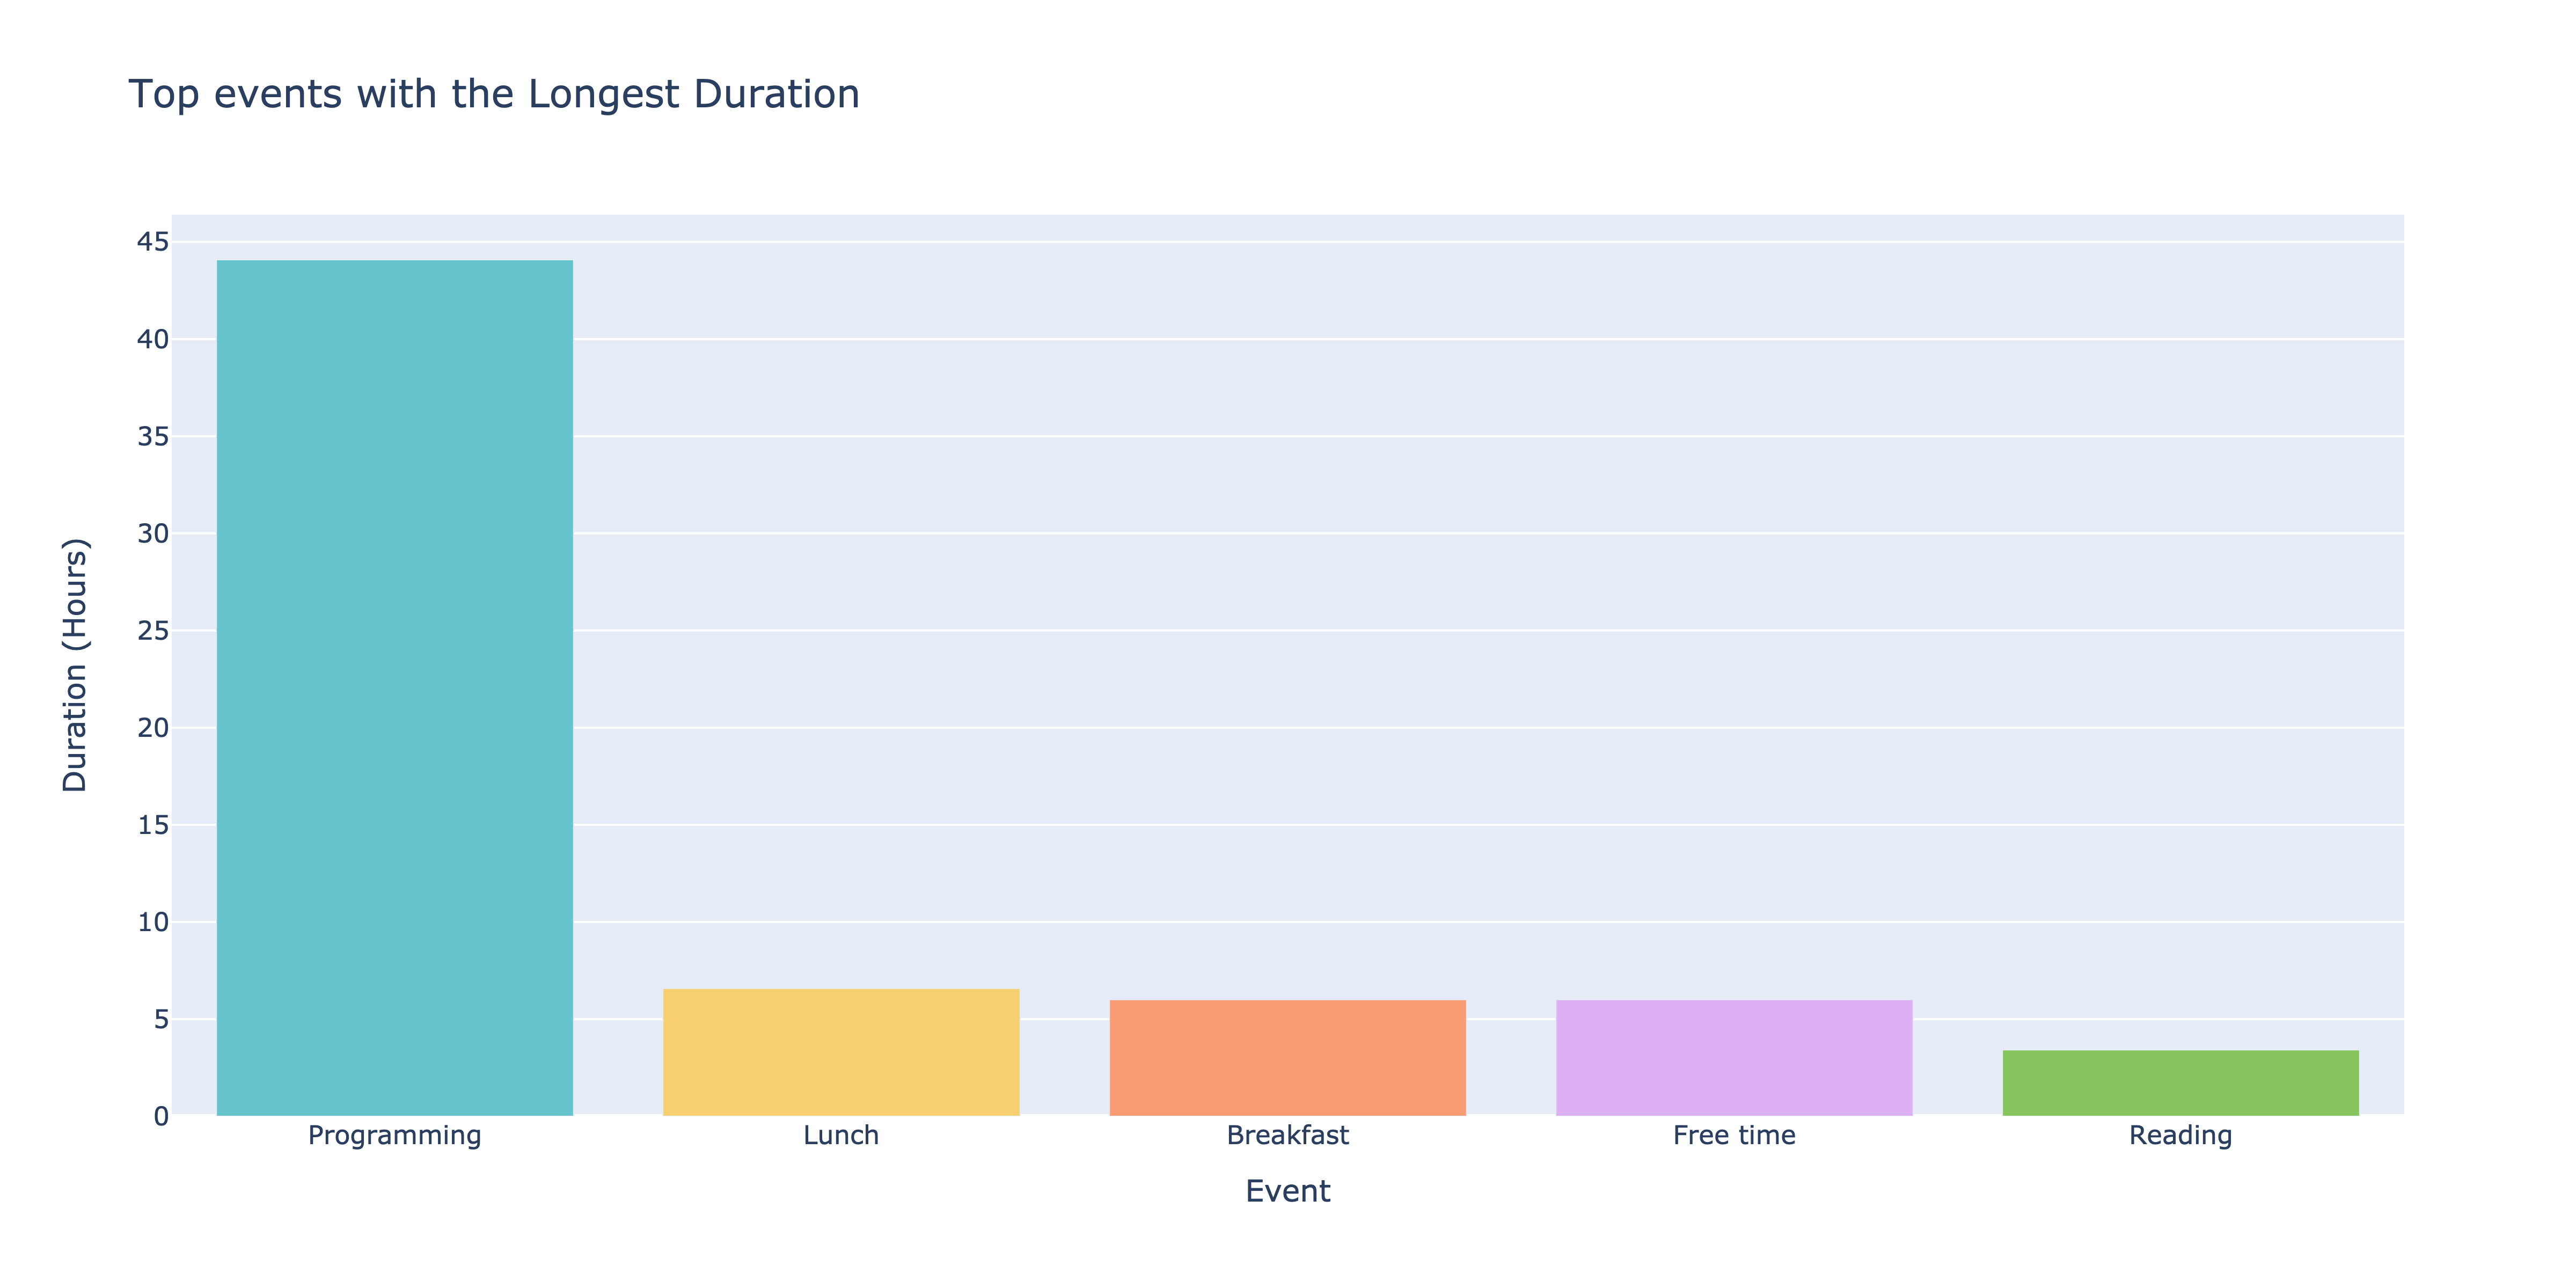
Line
MultyLine
Pie
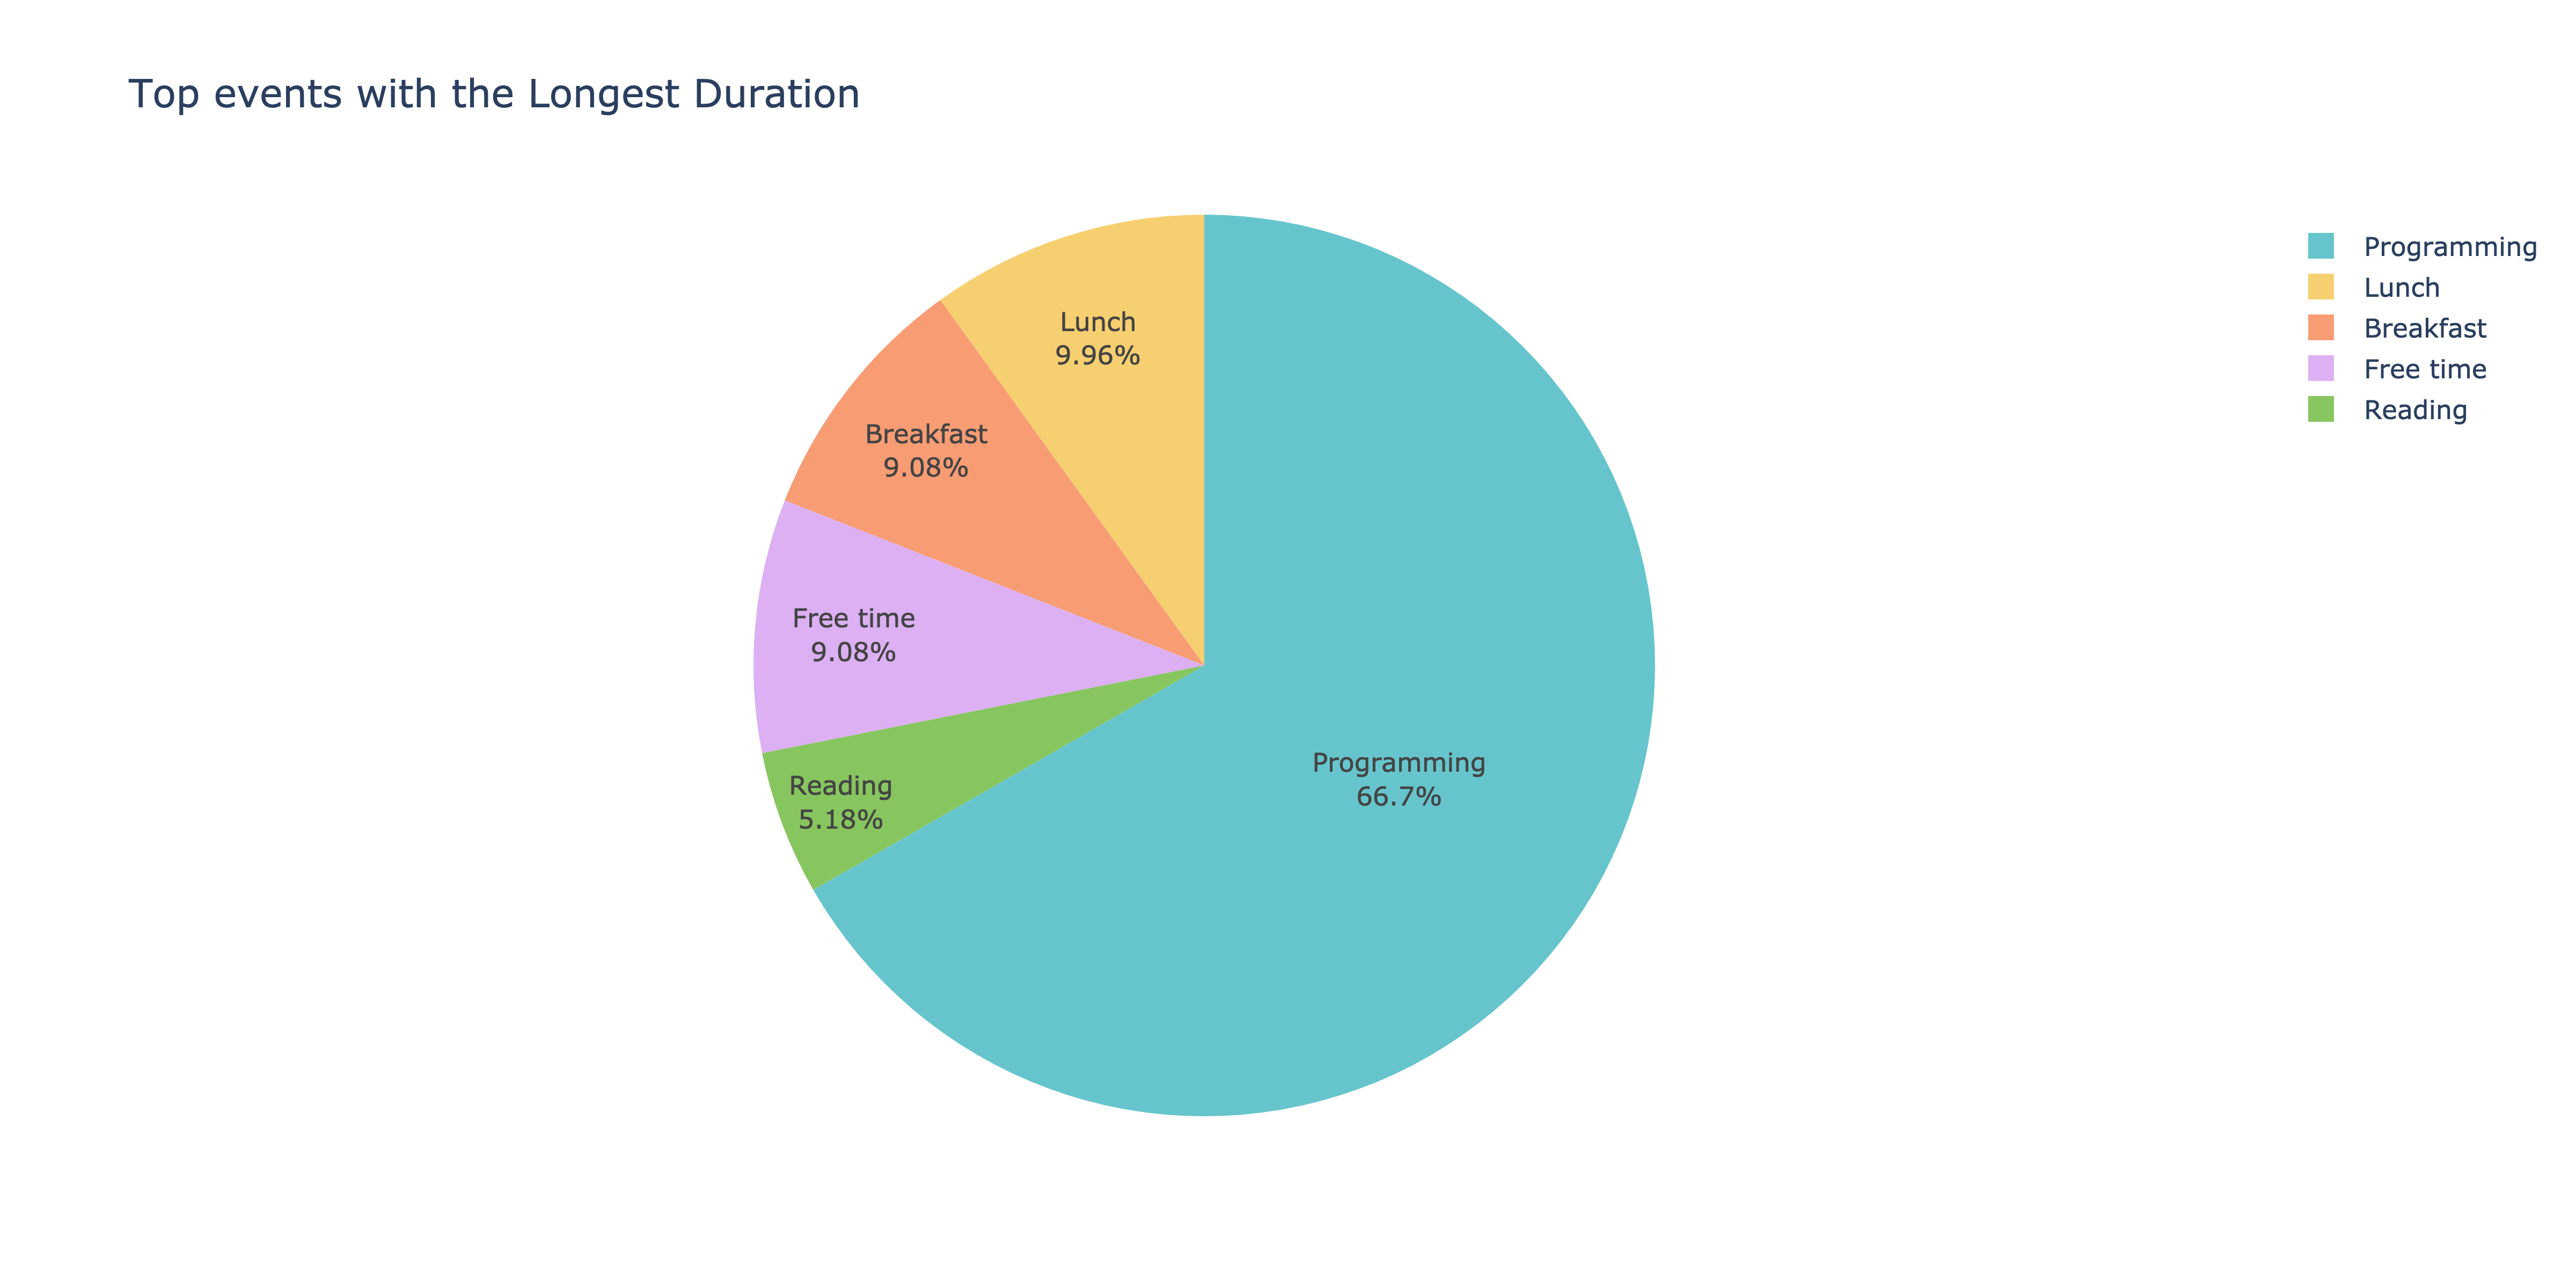
Restrictions
Note that not all plot types have the max_events variable available. If you want to limit the number
of events to be analyzed, you should use the Bar, Pie plot type instead of Line or MultyLine.
Also, you can't use analyze_many method with Line or MultyLine plot types because
these plots are not suitable for multiple events.